Last month we published a piece entitled COVID-19 as a Societal Accelerant. In it we spoke about the bifurcation of cloud vs. land jobs and noted that Bessemer’s Emerging Cloud Index was +13.2% YTD vs. NASDAQ (-2.6%), the S&P (-12.6%), and the Dow Jones (-18.0%). Fast forward ~6 weeks the cloud index is now +45.9% YTD, NASDAQ +9%, S&P (-6.4%), and Dow (-11.9%). The magnitude of outperformance has led many to call this another mini-Tech bubble, pointing to the fact that companies like MSFT have a larger market cap than the entire U.S. junk bond market, the NASDAQ has a greater market cap than the rest of the world’s stock markets combined, and tech stocks are sitting at all-time highs. This all on the back of another 1.5mn people filing for unemployment this week, which brings the 14-week total to ~47.0mn. So something on the surface doesn’t seem to jive.

Will SaaS stocks define gravity and continue to move up and to the right in perpetuity? No. Is there reason to believe some of the macro dynamics at play have led to a more secular as opposed to a cyclical shift in a re-rating of valuations? Maybe.
Cloud / SaaS Stock:
Robert Smith, the founder and CEO of Vista Equity Partners is arguably one of the Top 5 investors alive. At Vista he manages over $57 billion in equity commitments, oversees a portfolio of 65 enterprise software companies, and has completed over 400 transactions representing $130.0 billion in transaction value. He’s returned ~31% / year net to investors since starting the fund in 2000; and we think you’d be hard pressed to find anyone with a track record like that across PE, Public Markets, or Venture in a systematic and replicable process; particularly at that scale.
In 1999 at the height of the tech bubble as Goldman Sachs’ first employee in SF focused on Tech M&A, he advised on over $50bn of M&A activity with clients ranging from Yahoo, to Microsoft, Texas Instruments, eBay, and Yahoo. Despite dealing with the largest companies in the industry at that time, his interest was more aligned with a company called Universal Computer Systems in Houston, which offered a software product for auto dealerships. The margins were higher than any company he looked at, and the owners were taking FCF and throwing it into CD’s as they didn’t know what to do with all the money they were making. Smith asked them why they didn’t buy other mature software companies, implement best practices and roll them up? They said it wasn’t for him but offered to stake him with $1.0bn to get started.
Smith tried to get GS to do this first; but at the time the time banks didn’t lend to software companies because they didn’t have “hard assets.” How was he supposed to run an LBO fund without the key “leverage” piece? Smith knew banks would see the world differently as software was “eating the world” and companies serving different industries would inherently be diversified with recurring revenue streams.
Smith famously said, “Software contracts are better than first-lien debt. You realize a company will not pay the interest payment on their first lien until after they pay their software maintenance or subscription fee. We get paid our money first. Who has the better credit? He can’t run his business without our software.”
Michael Milken when talking about Smith & B2B software said it really is the “Central Nervous System” equivalent for many companies.
We believe this is what the market is finally starting to appreciate ~20+ years after Bob Smith first articulated this and got his thesis shut-down for banks to continue to underwrite the “Pets.Com” of the world. During the COVID-19 pandemic as companies were delinquent on debt payments, cut payroll, stopped paying their lease or mortgage, accrued legal liabilities, etc…. those software systems that were the “Central Nervous System” equivalent were never in danger of being cut and were the only bills paid in late March / April into May. We had a number of private companies who stopped paying their lease and legal bills but continue to pay AWS / Azure / DataDog / Okta / Twillio fees; because they don’t have a business without them.
In times of market volatility like we’ve seen over the past 4 months’ correlations initially go to 1, and then intra-sector correlations or themes tend to trade with a correlation of one. In 2020 it’s a meme driven market with Cloud / SaaS stocks trading together. That being said all companies aren’t created equally and in order to pick the winners on the back end of this you need to determine where each software company sits in the “Stack” for each customer and industry. Security, infrastructure, DevOps, service desk, collaboration, communication, CRM, marketing and HCM will all be impacted differently across industries and customer types. We’ll find out which business software is the “Central Nervous System” and which is an “Appendix.”
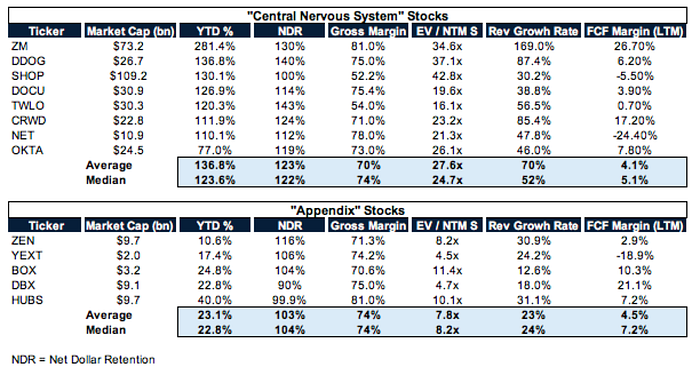
Central Nervous System: As mentioned at the beginning the Bessemer Emerging Cloud Index is +45.9% vs. the NASDAQ +9%, S&P (-6.4%), and Dow (-11.9%). If we look at the top performing constituents it’s companies like ZM (+281%), DDOG (+137%), SHOP (+130%), DOCU (+127%), TWLO (+120%), CRWD (+112%), NET (+110%), and OKTA (+77%). These are all mostly companies we’d classify as “Central Nervous System” companies.
Unfortunately, the market doesn’t bifurcate SaaS stocks into “Central Nervous System” and “Appendix” for you; however, there’s a few metrics you can look at to facilitate this analysis, most notably Dollar-Based Net Retention.
In a subscription business there are two primary ways to grow revenue: 1) Add New Customers 2) Get Existing Customers to Spend More on the Platform. Sounds pretty straightforward & simple. If a company is able to get existing customers to upgrade or expand their services, this is usually higher margin business and in some vein could be viewed as indicative of how critical the software is to its customers.
Zoom (ZM) +281%- Zoom has become a verb over the past 4 months and this far into quarantine it’s hard to imagine a world where meetings were actually held in person. This is one I debated as to whether or not it’s truly part of the CNS. Collaboration software has become such a critical part of the tech stack as it pertains to remote work and given the acceleration of remote work it feels as if this should be include as part of that suite of tools. Zoom’s level of outperformance has been driven more by memes / thematic trading versus anything standalone. But it’s metrics are impressive.
· Net Dollar Retention- In the Zoom 10-K they quoted their TTM net-dollar expansion rate at customers with >10 employees at 130%.
· Gross Margin- 81%
DataDog (DDOG) +137%- DDOG is a cloud monitoring & analytics tool for developers, IT operations teams and business users. The platform integrates & automates infrastructure monitoring, application performance monitoring, and log management to provide real-time observability of customers’ entire technology stock. When people talk about the IPO market being broken look no further than DDOG to dispute that notion that good companies can still excel on the public markets. DDOG went public in September of ’19 at $27/sh vs. $88.50 last.
· Net Dollar Retention- One of the most impressive metrics about DDOG is that net dollar retention figure of 140%.
· Gross Margin- 75%
Shopify (SHOP) +130%- Shopify like Zoom has become part of the meme / thematic trading baskets as the poster-child for eCommerce. As everything offline moves online, SHOP is one of the single largest beneficiaries of this trend by enabling eCommerce solutions for traditional brick & mortar businesses. The SHOP platform allows merchants to set up online storefronts with retail functionality, they can utilize the software to run business across all sales channel (web & physical retail), while providing merchants a single view of their business & customers. There’s a point in time where Shopify is unequivocally a Central Nervous System piece of software.
· Net Dollar Retention- ~100%. The bull bear debate around SHOP (outside of valuation) often revolves around net dollar retention and churn. The bulls point to the fact that it’s so easy to start an eCommerce store on SHOP that higher churn is actually better. The platform is scalable in a way that a million new people can start a business and 950,000 of them churn so they have 50,000 new customers. Given the marginal cost is close to 0 a high churn could be interpreted positive. The bears note that net dollar retention can oscillate as low as 80% and at some point we’ll hit a capacity for how many online storefronts would want to use their service.
· Gross Margin- 52.2%
DocuSign (DOCU) +127%- Who would’ve thought digital signatures would be a $30.0bn business? Like Zoom it feels like DocuSign is borderline a verb at this point (which is ironic because it’s more long winded than “sign”). The DocuSign Agreement Cloud is their cloud solution for automating & connecting the entire agreement process, including the signature eSignature business which is the world’s #1 solution.
· Net Dollar Retention- 114%
· Gross Margin- Subscription 82% | Total Gross Margin 75%
Twillio (TWLO) +120%- TWLO is a leading cloud communication platform enabling developers to operate real-time communication within software applications. They offer a set of APIs that enable developers to embed voice, messaging, video, and email capabilities into their applications.
· Net Dollar Retention- 143%
· Gross Margin- 54%
CrowdStrike (CRWD) +112%- CRWD is one of the leading players in what they call “Security Cloud” which they believe is the first multi-tenant, cloud native, intelligent security solution capable of protecting workloads across on-premise, virtualized, and cloud-based environments running on a variety of endpoints such as laptops, desktops, servers, virtual machines, and IoT devices. As everything migrates to the cloud these security components such as NET & CRWD are undoubtedly part of that CNS suite.
· Net Dollar Retention- 124%.
· Gross Margin- Subscription 74% | Professional Services 35% | Total 71%
Cloudflare (NET) +110%- NET is a global cloud platform that includes security, performance & reliability services. The platforms aims to serve as a scalable, easy-to-use, unified control plane to deliver security, performance, and reliability across on-premise, hybrid, cloud, and SaaS applications. They discuss two separate Flywheels including their Network & Product Flywheels.
· Net Dollar Retention- In NET’s 10-K they highlight their dollar-based net retention rate for TTM at 112%, which compares to 111% in 2018 and 113% in 2017.
· Gross Margin- 78%
Okta (OKTA) +77%- OKTA is the leading provider of identify for enterprise. Identity is that critical foundation between users & technology. It has things such as single-sign on, API access management, Access Gateways, and Lifecycle management. They become this sticky layer where they are integrating into applications, devices, servers, and API’s which makes them more entrenched as part of that CNS.
· Net Dollar Retention- 119%
· Gross Margin- 73%
Appendix Stocks: These stocks aren’t necessarily critical pieces of business infrastructure and could be supplemented either by an offering from a CNS provider or some other fashion; and is indicative in performance.
ZenDesk (ZEN) +10.6%- ZEN is a service-first CRM built for companies to deal with the broader set of customer interactions, allowing organizations to deliver Omni channel customer service, customize and build apps across the customer journey & beyond into support sales. When times are good / mediocre this is an important business. In times of wide scale cost-cutting companies are thinking long and hard about how much they need to spend here (which may or may not be short-sighted).
· Net Dollar Retention- 116%
· Gross Margin- 71.3%
Yext Inc. (YEXT) +17.4%- YEXT is a search experience cloud company that lets business structure facts about their brands in a database they call Knowledge Graph. The platform is built to leverage the structured data stored in the Knowledge Graph to power direct answers on a business’s own website, as well as across approximately 175 service and application providers, which they refer to as their Knowledge Network, and includes Amazon Alexa, Apple Maps, Bing, Cortana, Facebook, Google, Google Assistant, Google Maps, Siri and Yelp. Again in a world where companies are cutting costs this remains outside the CNS.
· Net Dollar Retention- 106%
· Gross Margin- 74.2%
Box (BOX) +24.8%- BOX / DBX became household names over the past decade as leading cloud content management companies. While they were pioneers they saw the behemoths like Apple, Microsoft, and Google start to encroach on their territory on both the consumer & business side of the business. While storage is critical
· Net Dollar Retention- 104%
· Gross Margin- 70.6%
DropBox (DBX) +22.8%- Same as BOX above.
· Net Dollar Retention- 90%
· Gross Margin- 75%
HubSpot (HUBS) +40%- HUBS provides a cloud-based marketing, sales, and customer service software platform. The software augments a number of internal processes such as CRM / Sales Pipeline, etc.. This again is something that’s not part of a CNS when spending pulls back.
· Net Dollar Retention- 99.9%
· Gross Margin- 81%
The purpose of differentiating between “Central Nervous System” vs. “Appendix” cloud stocks isn’t’ to suggest that those companies that fall into the latter category are bad companies. If you look at their gross margins, and FCF margins on an LTM basis sometimes they’re even in excess of those stocks that fall into the “CNS” category. It’s to highlight Robert Smith’s point about software contracts being more secure than first-lien debt for some of these companies; it looks like it is and the market is rewarding those stock prices for that with valuations 2–3x those of non-CNS stocks. The higher NDR by ~20% is also partially responsible for the higher growth rate which is also ~2–3x. This is all reflected in stock price performance with “CNS” stocks +135% on average YTD vs. “Appendix” Stocks up 23% (which would be amazing vs. any other sector).
Tech Bubble vs. Today
“This Time It’s Different.” Famous last words that usually occur at extremes where people try to defend the continuation of a trend that should revert. You never want to say this time it’s different & conversations / posts like this almost always happen at the top. We’re not going to pretend to know the direction of equity markets over the next 3–12 months but over the next 5–10 years we’re confident it’s higher. There are real differences with the outperformance of technology today vs. the tech bubble in the late 1990s into 2000.
· Tech Valuation- During the tech bubble the sector as a whole was trading at ~90x earnings & this wasn’t just Internet Stocks. You had companies like CSCO trading at 200x earnings, MSFT 67x, IBM at 50.0x; with $100bn+ companies trading in excess of 100.0x earnings. Service companies with .Com in the name saw valuations quadruple overnight. While we’re seeing froth in the market with all things “Cloud” “SaaS” and yes “SPAC” we’re still slightly more grounded in reality.
o If we compare that to where we are today you have companies like AAPL, FB, MSFT, and GOOGL trading 25–30x. While this may screen rich given the size of these companies today, the margin profiles & FCF generation have never been better and need to be taken into consideration in context of the broader market.
· Broader Market Valuation- The S&P 500 trading multiple has trended gradually higher over time due to a # of factors all of which have an impact on where the “highest quality” stocks should trade; with the most constructive macro backdrop (which these B2B software companies have).
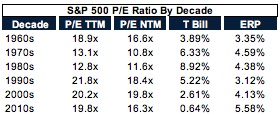
o Lower Interest Rates- You cannot look at equity valuation multiples in a vacuum without considering interest rates. If you take a look at the equity risk premium (“ERP”) the 2010s had the highest ERP on record due to artificially low interest rates. This lowers the discount rate used by investor (higher discounted PV of future cash flows) which is immediately worth a few turns in it of itself.
o Passive / Indexing- It’s never been easier to diversify & index. Diversification across 500 or 20000 stocks with a single ticker; but diversification isn’t limited solely to the # of stocks. Given globalization you’re also getting geographic diversification which all else equal support higher multiples.
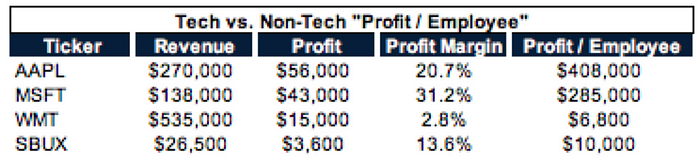
o Margins- Technology has a deflationary effect on pricing. This has resulted in margin expansion for companies across the board but particularly tech companies. As you think about SaaS / Cloud Deployment with minimal marginal cost of production that’s almost all incremental margin which is why gross margins have trended higher over time. This is perhaps most readily understandable by looking at earnings power per employee outlined below:
Macro Environment:
What else is different vs. the late 1990s? We’re sitting on the back of 12+ years of quantitative easing now. We often say QE turned your savings account into your checking account, the bond market into the savings account, the equity market into the bond market, venture into the equity market and gave life to the crypto market as the equivalent of venture risk pushing everyone out the risk curve.
So what does that mean within the equity market? If you’re being pushed out the risk curve between asset classes, it’s logical to conclude you’d be pushed out within them as well which is part of the reason you’ve seen an outperformance of growth equities vs. value. While this is regime dependent given the ~$7.0 trillion of liquidity that’s been injected into the market over the past 3 months from both a monetary & fiscal policy perspective it’s hard to see how that doesn’t reflect in equity valuations. Stanley Druckenmiller joins Robert Smith as one of arguably the Top 5 Investors alive; as the only other person we know of with a track record of compounding at 30%+/year over a multi-decade period with that sizable asset base. Druckenmiller has always honed in on interest rates & liquidity as the biggest drivers of stock prices.
Not only is the backdrop different from a liquidity / interest rate perspective (globally & domestically) but the macro demand for all things technology has grown exponentially. Gartner expects worldwide IT spending to total $3.4 trillion in 2020 which is actually down 8% from 2019 due to COVID-19. They expect that to be $4.0 trillion in 2021. This compares to ~$1.9 trillion in ’98, $2.0 trillion in ’99 & ’00. Gartner expects Cloud Spend to grow from ~$230bnb/year to $350bn/year over the next 2 years…that was a $0 in 2000.
Shape of the Recovery?
Go on CNBC, read the WSJ, the FT, Bloomberg, or scroll through StockTwits or Twitter, or even DDTG and conversations talk about a “V” “L” or “W” recovery. People think the market is pricing in a “V” shaped recovery given the snapback of stocks. What is in a stock price? In a recent podcast with Barry Riholtz, Wharton Professor Jeremy Siegel reminded listeners that a stock price is supposed to reflect the value of Discounted Cash Flows in the future to today. If a DCF is representative of 20 years of cash flows and we were to wipe out 100% of their earnings over the next 12 months how much should the stock price go down all else equal? In his view 5%.
We can debate if that’s too academic in nature (clearly in March that was the market’s reaction). But if market participants are “looking through” 2020 as a “one-off” due to the pandemic and 2021 is only unchanged to 2019 (there’s a lot of reasons to expect it to be greater) you should only be talking about a mid-single digit hit to stock prices which is where the non-cloud non-secular tailwind equities are today.
Where Do We Go from Here?
Where should these stocks trade on a multiple basis? We don’t know. Is 25.0x NTM EV/S too high? Probably. But in a world that’s being injected with liquidity to prop up asset prices is it logical for those dollars to chase the “fastest horses”? Yes. When you talking about revenue growth rates of 70–100% that’s a doubling every 1–1.02 years which is a quadruple every 2–2.05 years. That means in two years’ time that multiple looks “reasonable” and in 5–10 years’ time it looks incredibly cheap today; particularly when you are discounting cash flows at a ~2–3% rate.
The benefit of private market investing vs. the public markets is there is no daily, monthly, quarterly, or annual scorecard. Investors have no choice but to allow them to compound year after year until an ultimate liquidity event. Think about those companies that are a critical part of the business software stack and look to own them for the long run. If you’re right on the thesis while the entry point may not be ideal, the market tends to work itself out. If you’re waiting to buy the highest quality names at prices that look reasonable today…you might be waiting an incredibly long time.